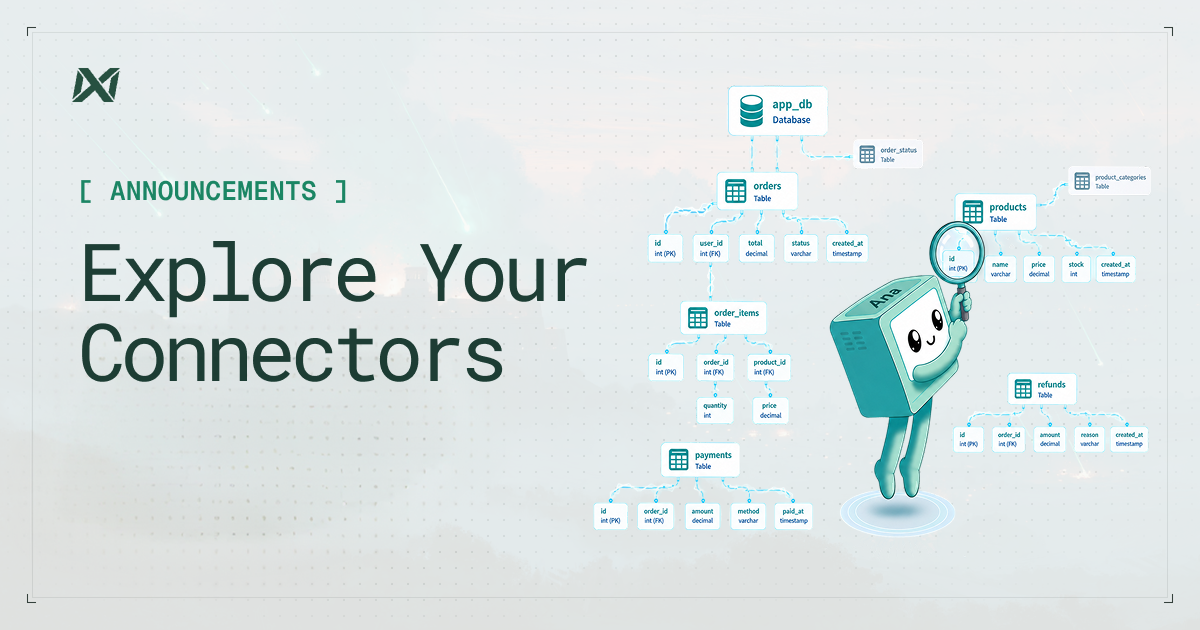
Every connected data source now has its own home. Click into any connector and you get a dedicated detail page that answers four things that used to require digging through logs or pinging a teammate: what's in this source, how it's being used, what's built on it, and what's already been asked of it.
Schema
Schema is a live, searchable browser. The table tree sits on the left, detail pane on the right. Search a table, click it, and inspect the columns, types, primary keys, and a preview of the actual rows. No exporting, no separate SQL client.
Usage
Usage shows you how the connector is actually being used, not just that it's connected. You get query volume over time with a 7/30/90-day window, the top users driving that volume, and the top query patterns. The patterns come from fingerprinting every query down to its structural shape, so a thousand variations of the same lookup roll up into one recognizable pattern with run counts, average runtime, and the tables it touches.
Chats
Every question ever asked of this source is in Chats. It's a searchable log of every chat grounded in this connector, each with a summary, a query count, and the tables it touched. Before you write a new thread, you can see whether someone already answered the question. Permissions are enforced at the RPC level, not just hidden in the UI, so org-wide chat history is only visible to members with the right access.
Dashboards
Dashboards is a searchable list of every dashboard built on this connector, each with its creator, last-active time, query count, and the tables it touches. The top of the page gives you the summary: how many dashboards were built this week, who's active, and the average query load.
Why this matters
A connector used to answer one question: is it working? Set it up, confirm the connection, and move on. Now it answers four. The questions that used to send you to logs or a teammate are answered on the page itself.
Open any connector and view how it's being used today.