
/ data apps · the story
The Art of Possible
Aaron Zhu · Member of Technical Staff · July 2026
Every new interface gave more people the power to see, decide, and act.
This is a story about that ingenuity: the maps, machines, and rooms people built to know their world. The art of the possible is the art of the interface. Whenever someone invented a better way to meet the numbers, more people could act on what they saw, and the possible moved again. It has moved four times. It is moving a fifth time now.
Record
First, we found ways to write the world down.
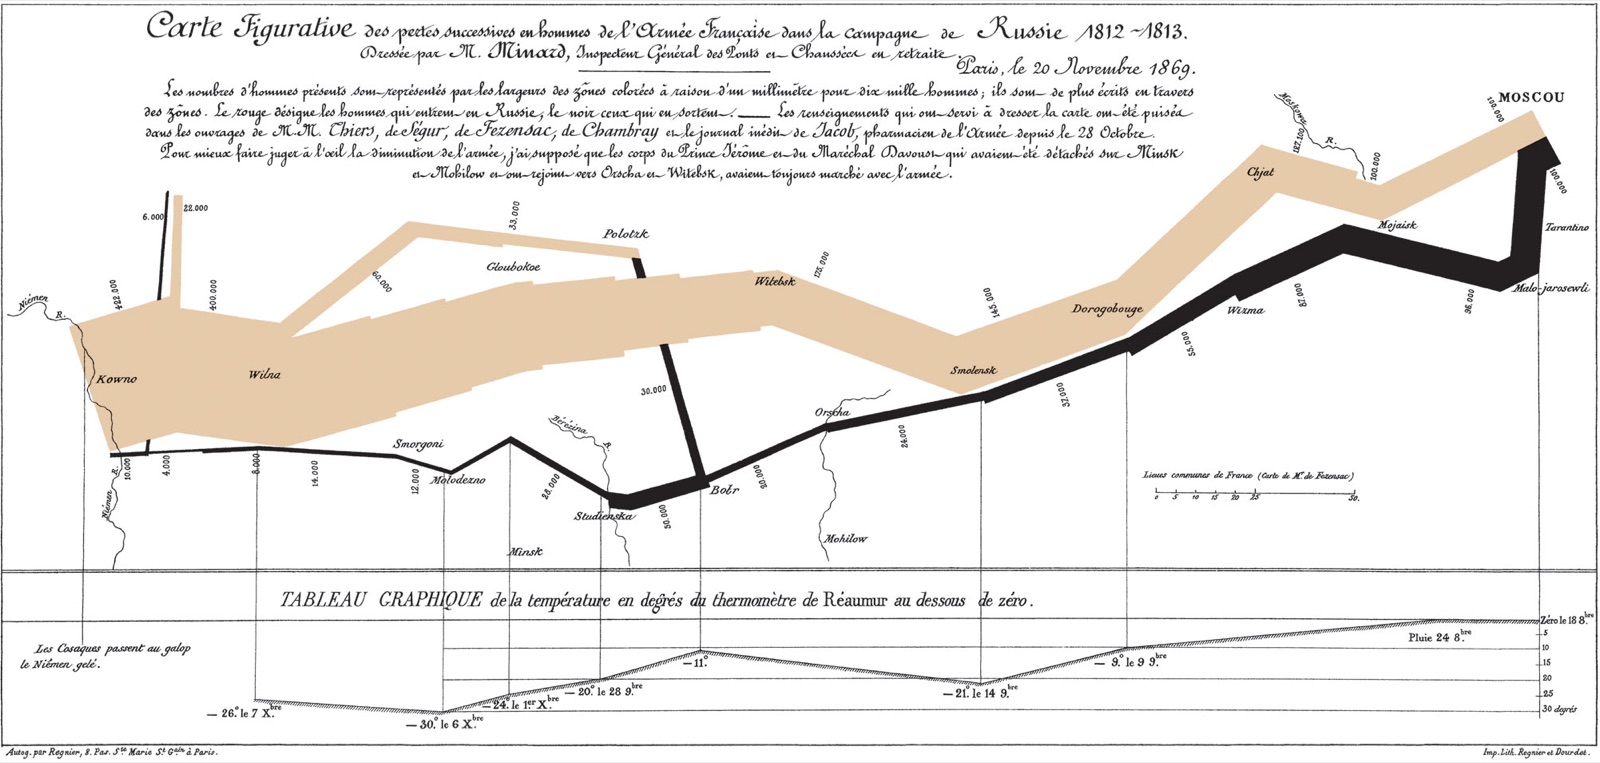
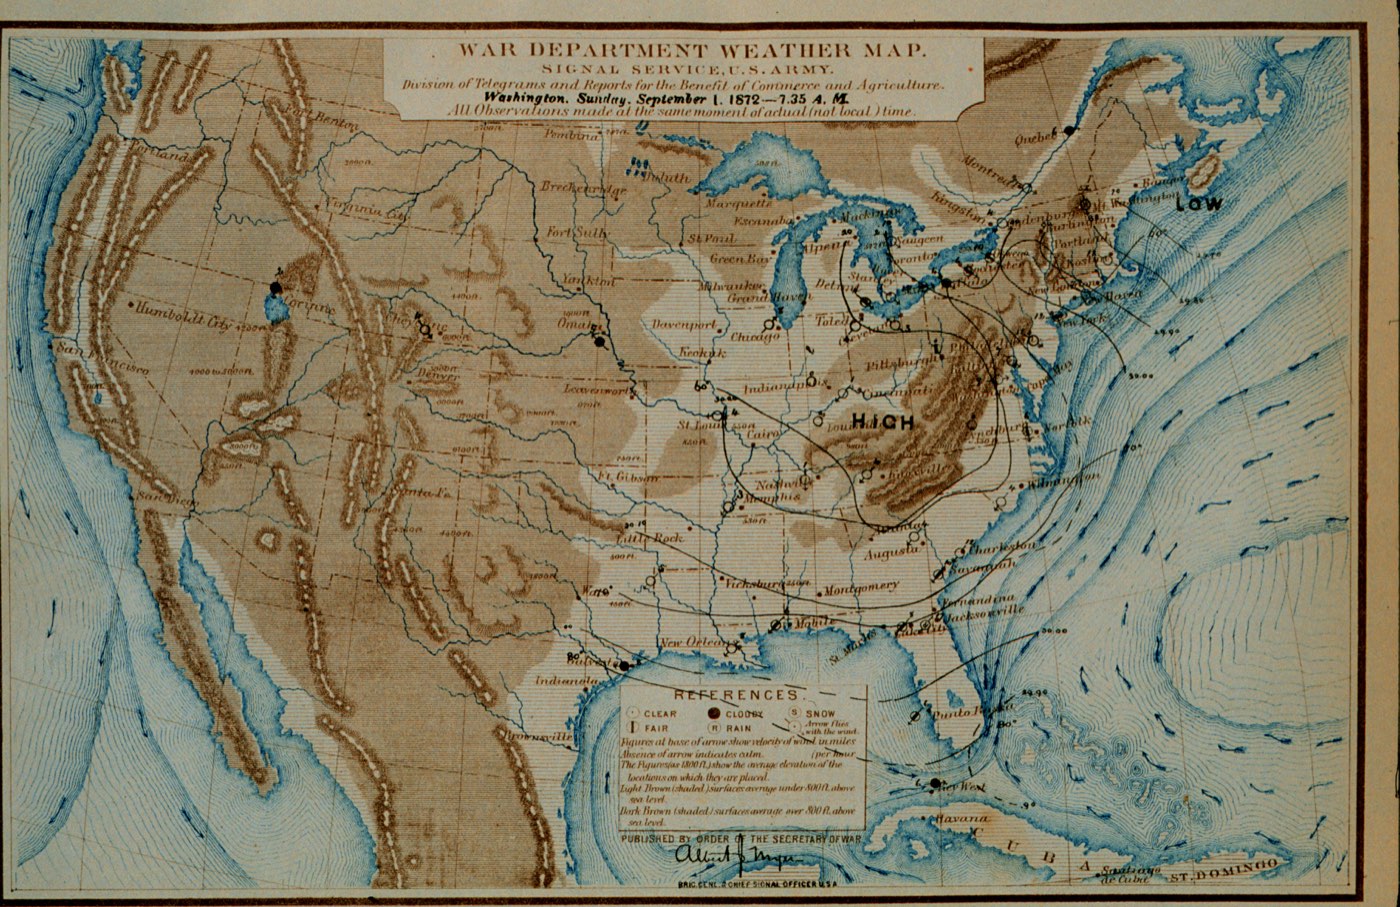
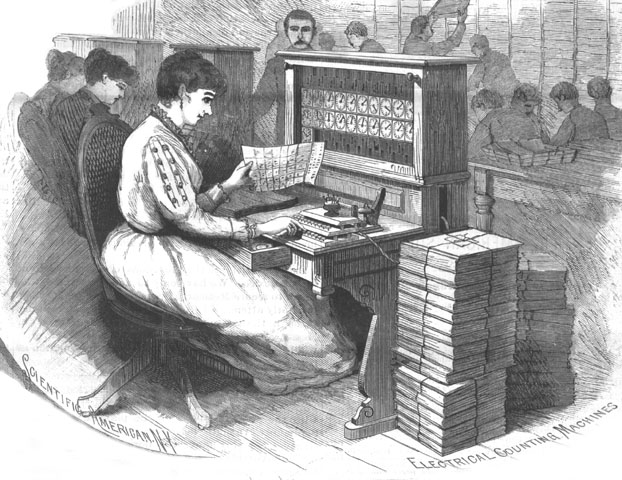
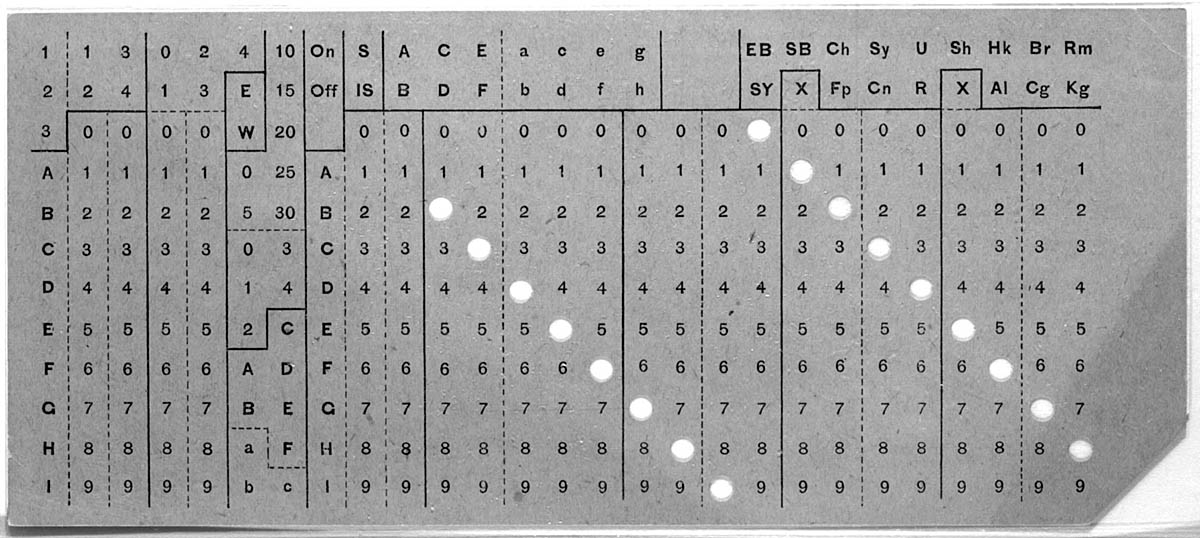
Data interfaces are older than computers. Minard compressed an entire war, men, miles, temperature, and time, into one picture you could read in a minute. The Army Signal Service printed a nation's weather every morning from a web of telegraph wires. Hollerith taught a machine to count 63 million Americans, one punched card per person. For the first time the world had a working copy of itself: measured, recorded, and stacked in drawers. Each was pure invention: nobody had seen an interface like it, and then everybody needed one.
See
Then, we built interfaces that let us see what was previously invisible.
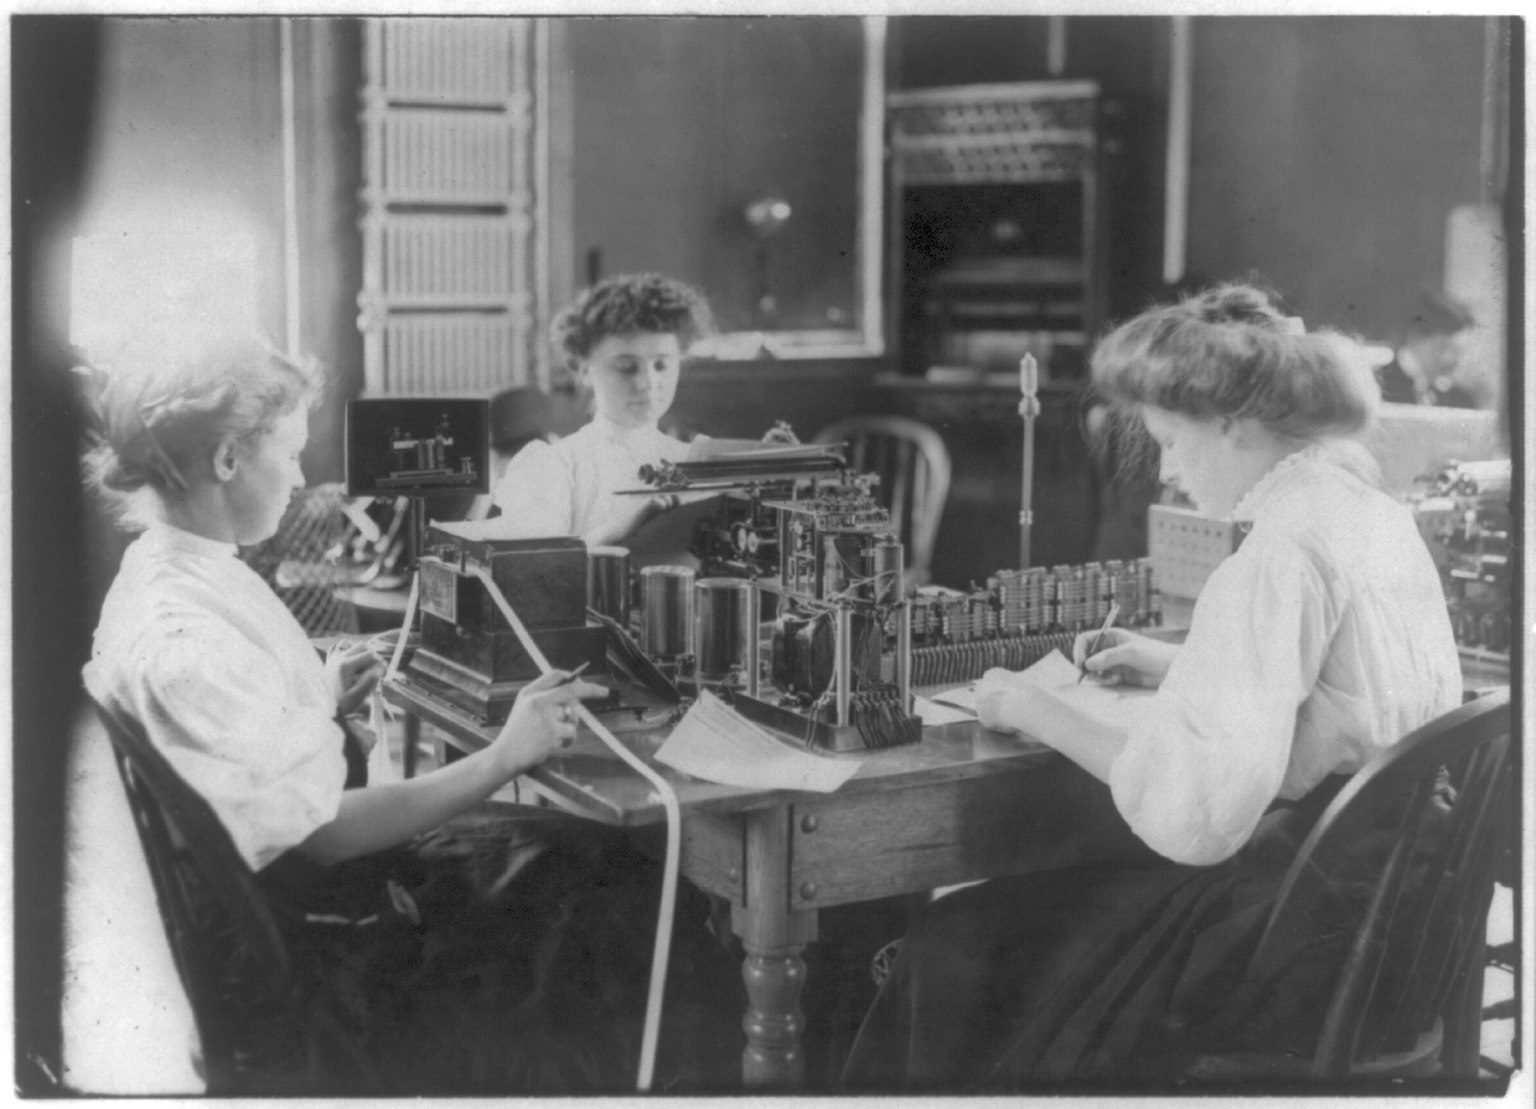
A record tells you what happened; people wanted to watch it happen. By 1932 the New York Stock Exchange was the fastest data machine on earth, and it was made of people: quote boys posting prices in chalk, brokers writing orders in longhand, the ticker pushing the whole market down a wire at the speed of ink. Then SAGE turned a continent of radar into one glowing picture of the sky.
Decide
Then, we gathered around the numbers and decided together.
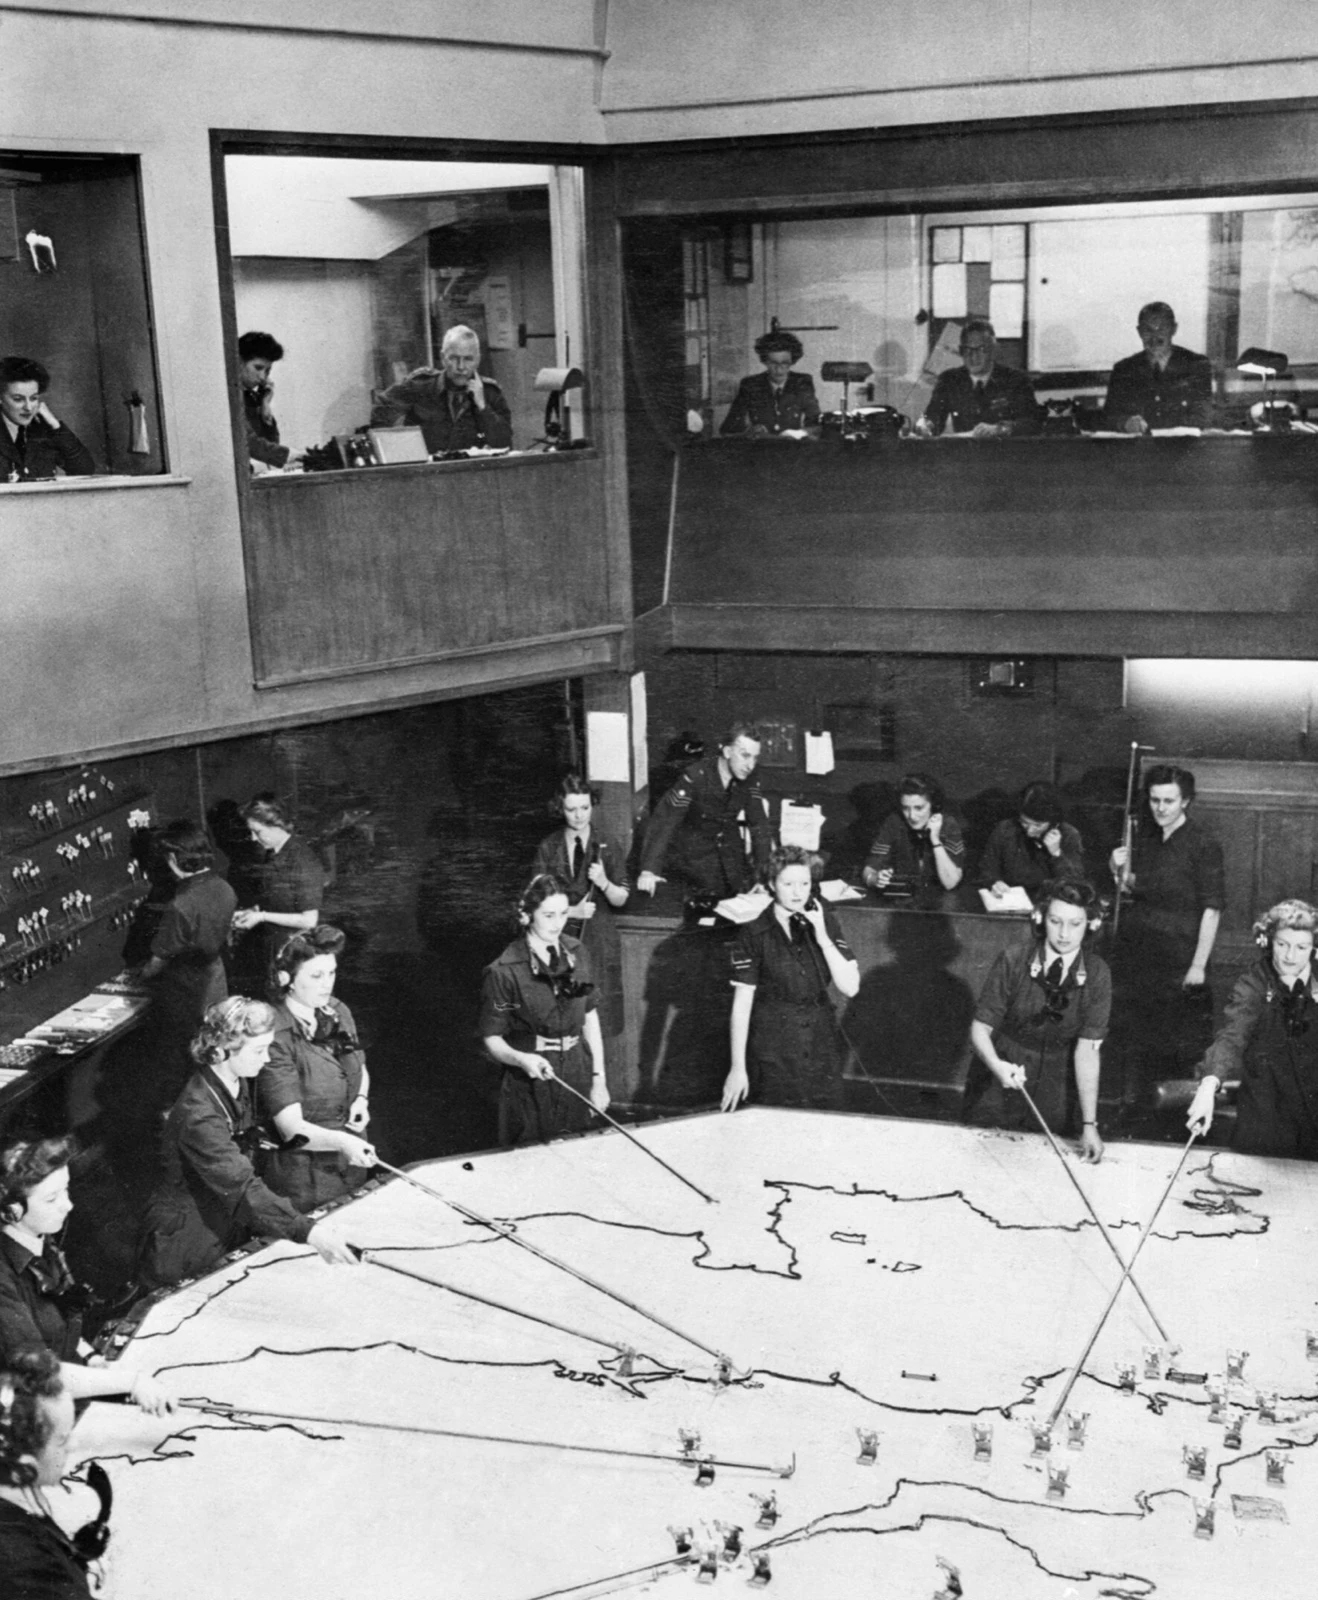
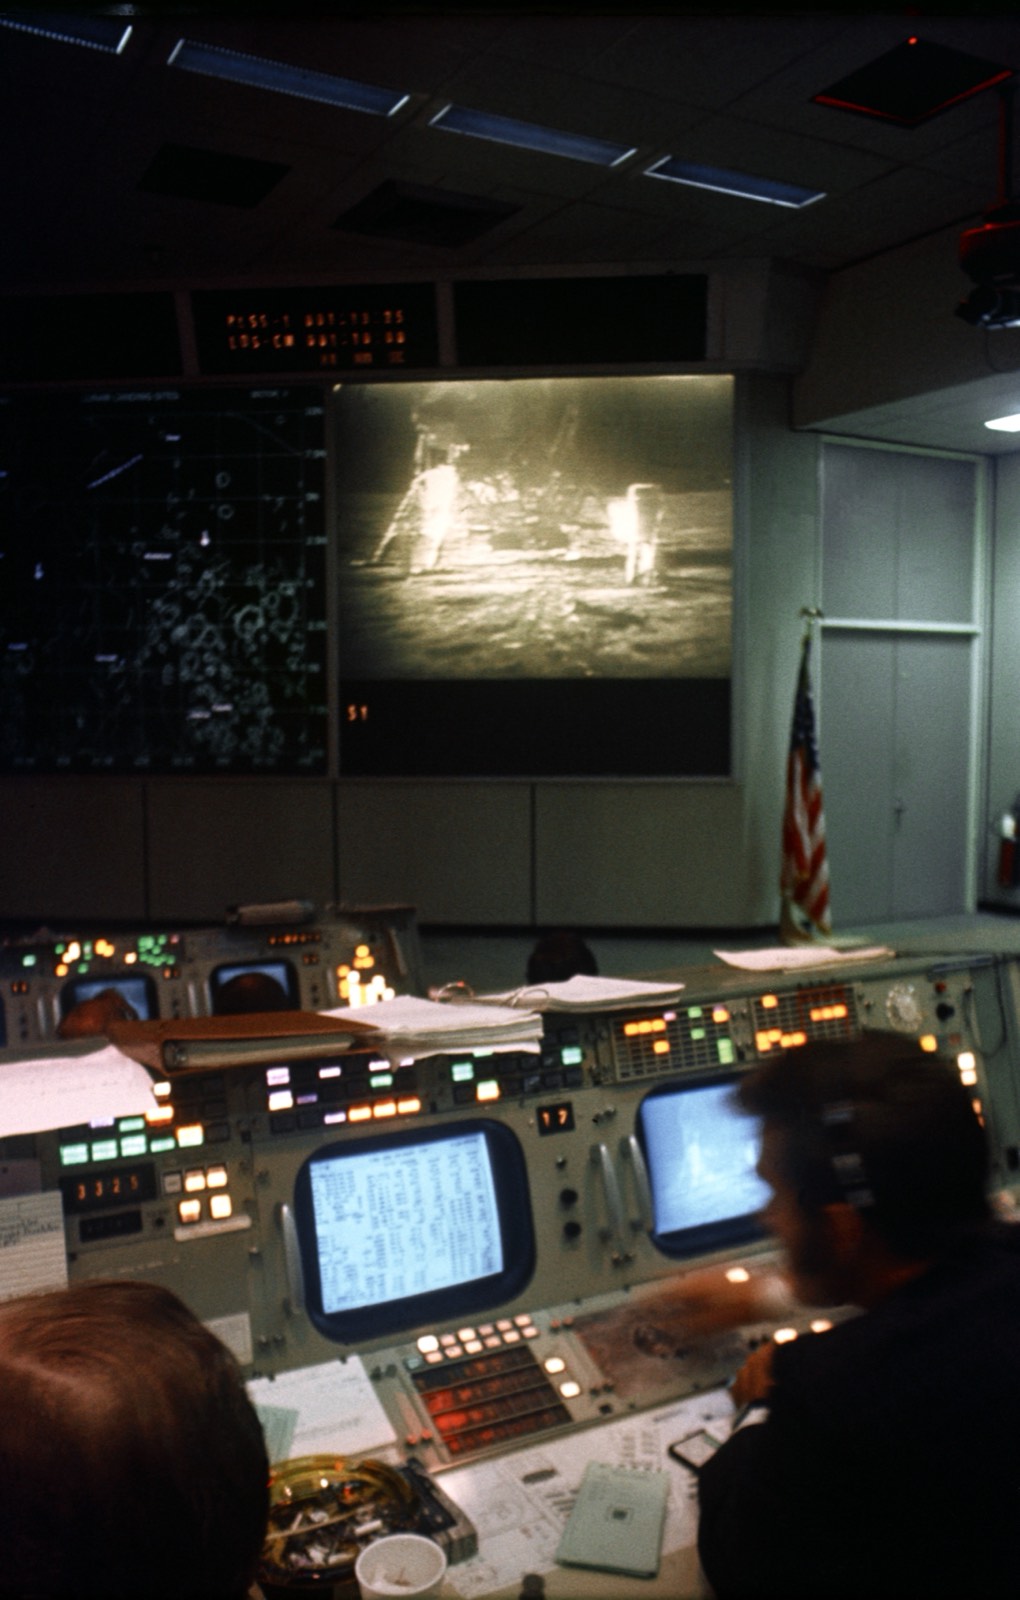
The order desk ran the whole loop in miniature: hear the number, make the call, write the slip that moves the money. The plotting room staged it at theater scale: WAAF officers raking aircraft markers across a map table, a battle played live so commanders could commit their squadrons. Apollo was the summit. Telemetry from a quarter million miles away landed on a console built for exactly one job, and the controller in that seat could see the number, make the call, and send the command back up in seconds. Nobody decided alone: every controller read the same screens, argued from the same numbers, and answered go or no-go around the room. It is still the most complete data interface human beings have ever built.
Explore
We stopped asking computers only to calculate, and began using them to think.
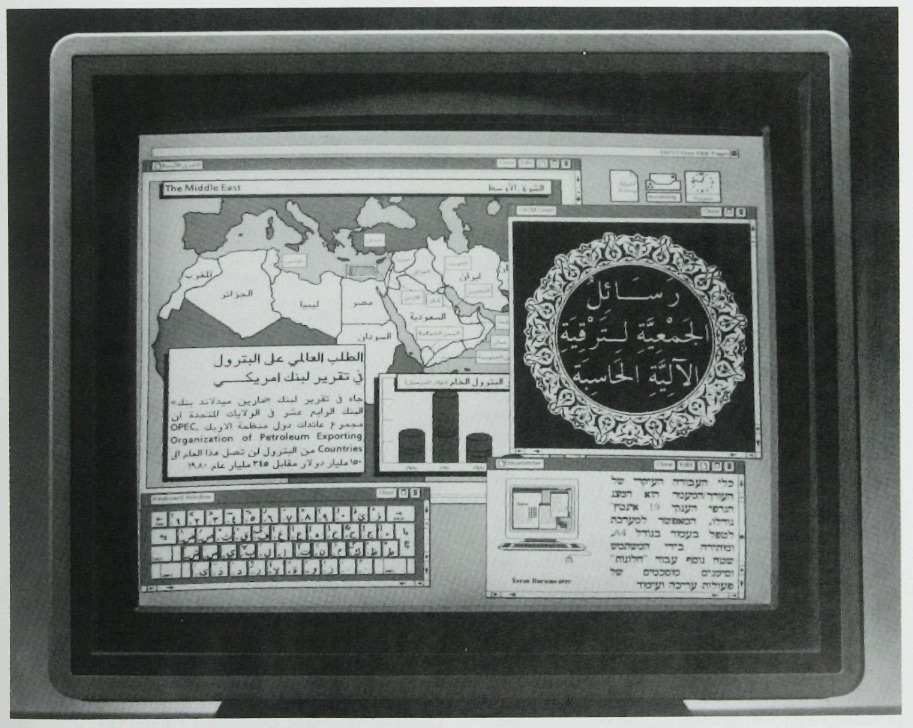
Grace Hopper had already taught machines something like English. In 1968 Douglas Engelbart pointed a mouse at a screen and showed the world what a computer could be, and Xerox put windows and icons on a desk and made the machine a place to work. Spreadsheets turned the ledger into a live model you could interrogate, BI put the same chart in front of a whole company, and the web let two people with a laptop ship an interface to the entire world. One frontier held out: tailored consoles, the Apollo kind, built around one person and one job, still took builders to make.
Create
Now, anyone can shape data into the interface their moment demands.
Data Apps are the next one. Describe what you need to see and do, and Ana assembles it in minutes: a working interface grounded in your ontology, running against your warehouse at petabyte scale. The person who needs the interface makes the interface. And the buttons work: see the number, make the call, write it back, every action logged and every change tracked. Two centuries of ingenuity, from a hand-drawn map to a room that flew to the moon, arriving at a console anyone can summon. This time, everyone gets a console.
The art of the possible just changed hands.
Minard had ink and a steady hand. Houston had a building full of engineers. You have Ana. Every leap in this story came from someone who could see what the moment demanded and had the means to build it. Data Apps put that means in everyone's hands: the analyst, the operator, the person on call at two in the morning. The newest plates in the record are already below: five working consoles, described into being this year. Show us what you make.